
BTC/USD Huge Warning Signs
Should we keep buying the dip or wait on the sidelines? We unlocked the details in this post.

Hello, premium members,
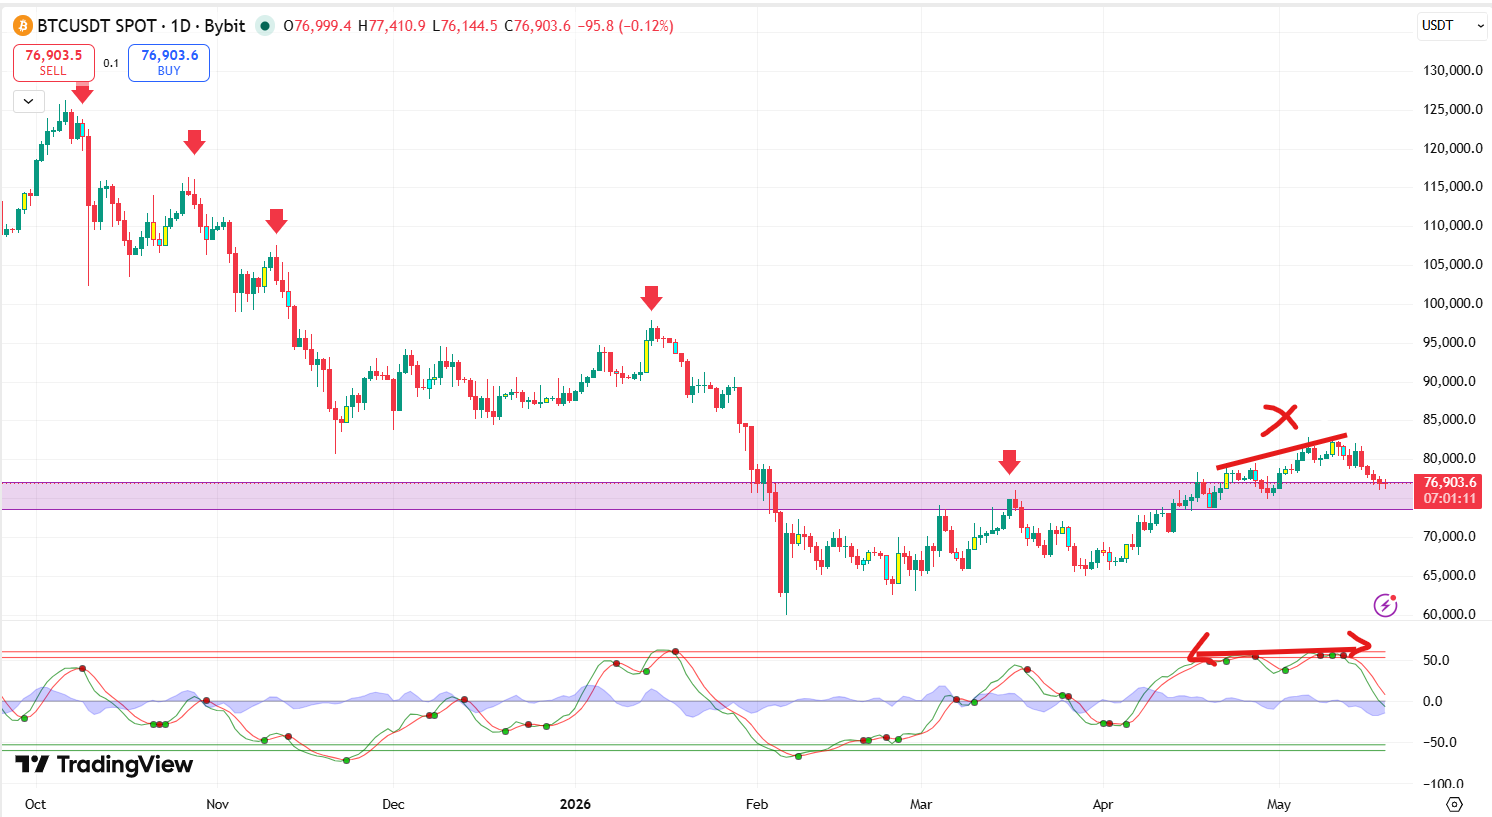
Bitcoin has just entered the upper boundary of our $74,000–$77,000 target zone. This pullback comes on the heels of the sharp rejection at our $82,000 resistance level—the exact structural roadblock we mapped out last week.
While this local top ($82k) was expected, we must continue to approach this market with caution. You may ask, what’s next for Bitcoin?
Although we remain long-term bullish on Bitcoin, I am pausing new allocations for now. The reason is simple: a strong bearish signal has appeared on the daily chart that we cannot ignore, namely a clear divergence on our momentum oscillator. (See the red lines below.)
As smart investors, we have to adapt and approach the market with flexibility rather than rigidity.
This is true because the trend doesn’t move in a straight line. The earlier we learn to align with it, the more profitable we become, whether as day traders or cycle investors. As they say, the trend is your friend until it’s broken.
So, let’s break down exactly what the chart tells us, how to preserve our dry powder, and the key levels that will determine our next strategic move.
The BTC/USD Daily Chart
If you look at the daily chart below, you will notice a stark structural mismatch. While Bitcoin’s price action managed to post a higher high, our primary momentum indicator formed a clear, rigid double top pattern.
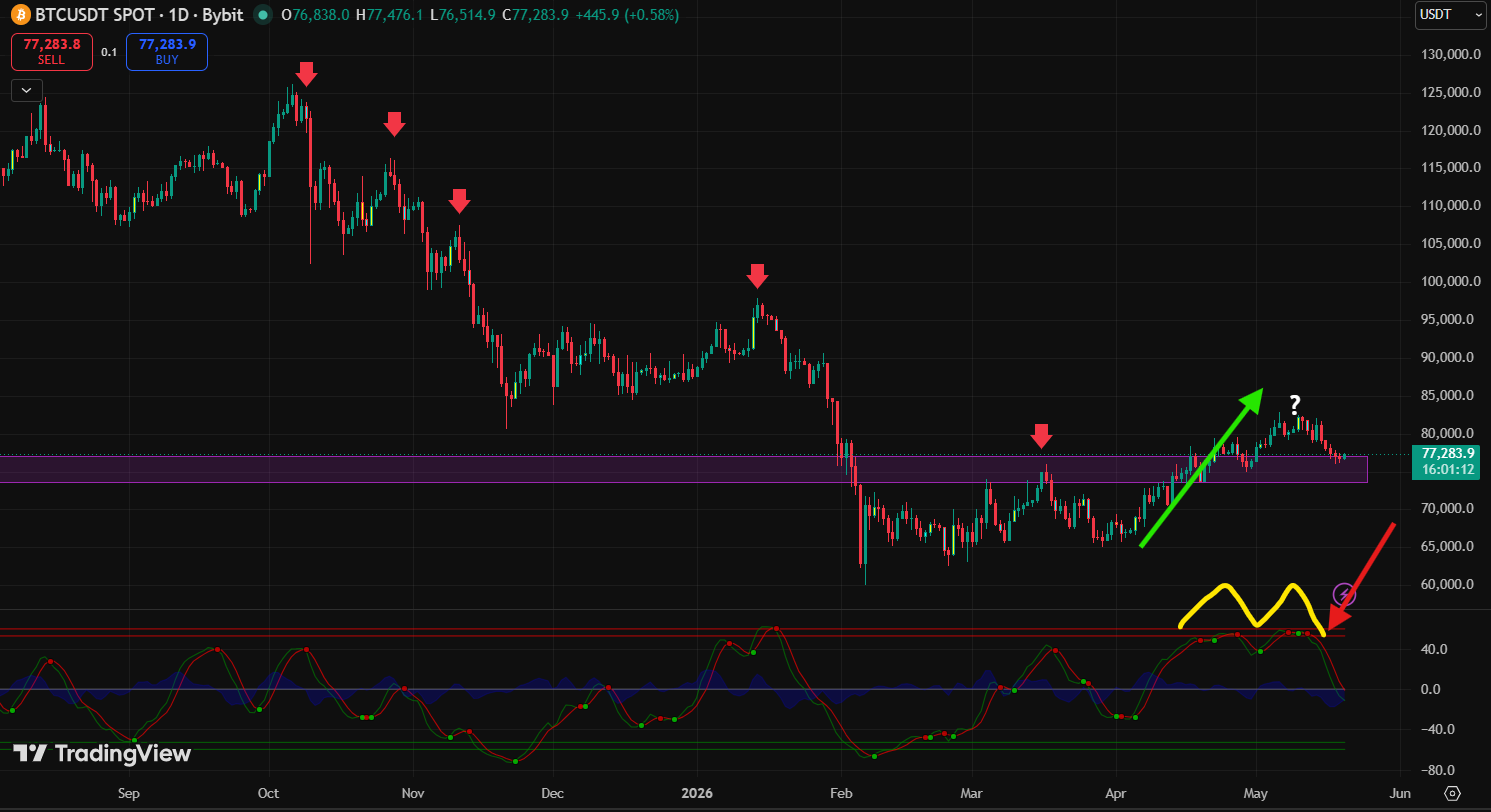
This is a textbook bearish divergence. It tells us that while buyers managed to push the price higher on the surface, the underlying structural strength supporting the move was rapidly weakening. This structural mismatch is neither coincidental nor something we can afford to ignore.
As a paid subscriber, you have exclusive access to this momentum tool and the other custom indicators we feature in our market updates. You will find the installation link at the bottom of this article.