
It Doesn’t Feel Real, But Capitulation is Here
Bitcoin has broken our neckline. Here is how to identify the bottom and why this capitulation is your biggest opportunity.

Today’s Letter is brought to you by Vintage Funds

There’s a reason mobile home parks are getting so much institutional love.
They remain one of the key affordable-housing sources nationally, have a limited supply, and high tenant retention (10-12Y).
Investors can see tremendous upside with professionally-managed MHP portfolios such as Vintage Capital’s, which targets a 15-17% IRR and makes monthly distributions. Invest directly in individual deals or via a 10+ property fund. 1031s are also available.
Hello investors,
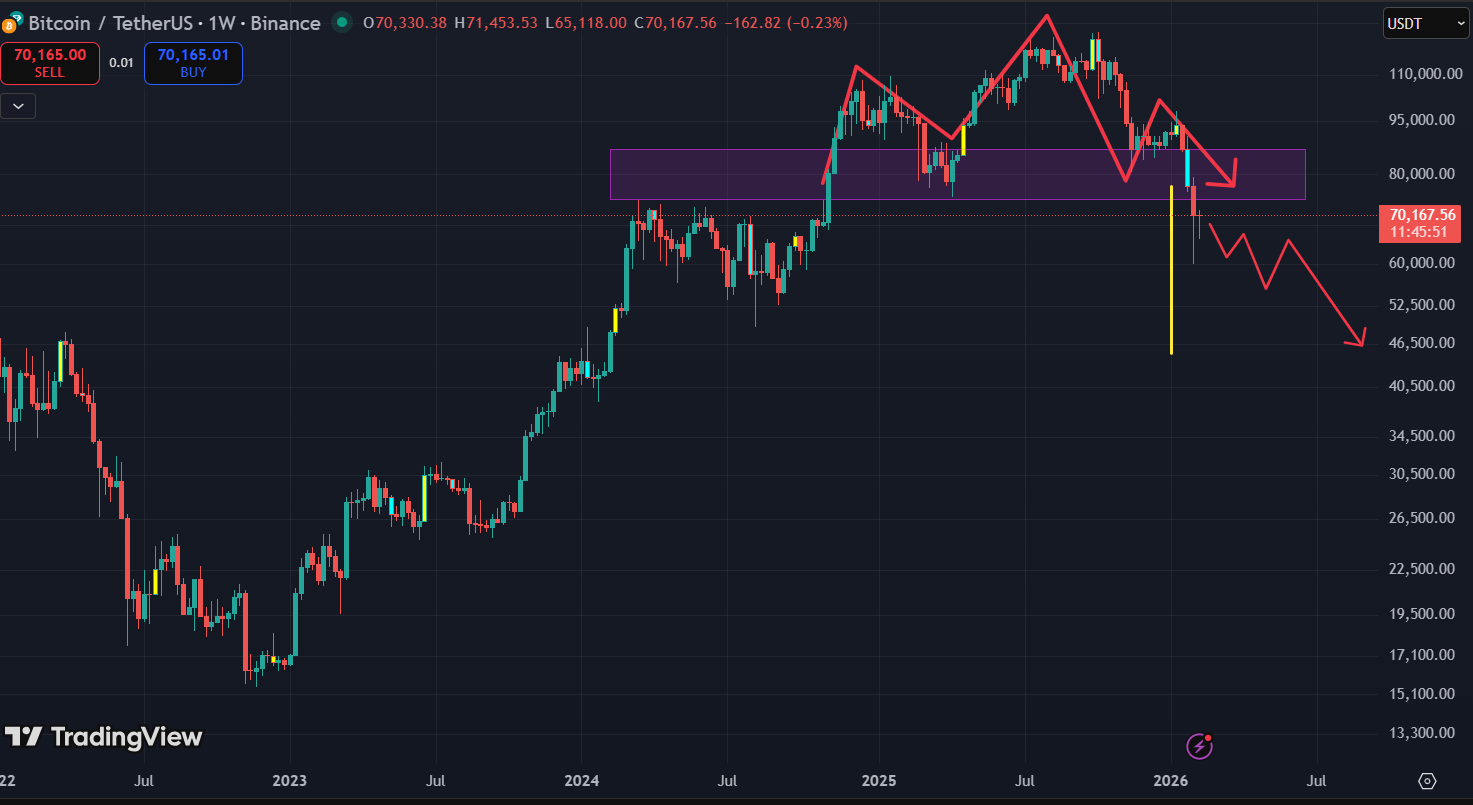
Bitcoin has officially entered capitulation after breaking and closing another weekly bearish candle below our critical $77k Head and Shoulders neckline. This phase is characterized by panic selling, high volatility, and liquidations. So, if you're wondering whether Bitcoin and the entire crypto market will keep declining for the rest of the year, check out the chart below and find the answers in this article.
Welcome back to another edition of Crypto Big Stories. I hope you are paying close attention, because the market is doing exactly what the charts warned us it would.
Recently, panic selling of Bitcoin intensified after the price fell below the massive weekly head-and-shoulders pattern we identified a few weeks ago. Since then, the market has broken below our critical neckline at around the $79000-$77,000 range, which once served as our main support.
Now, it seems all hell has broken loose, and Bitcoin is heading back to a level we haven’t seen since January 2024. But should we celebrate this breaking news or mourn our depleted portfolios?
As Bitcoin and altcoins keep falling toward our projected measured move from the head-and-shoulders breakdown, we expect some fake pumps and dead cat bounces along the way. But we must acknowledge that capitulation has already arrived, and most investors are now underwater. So, you might ask…
What is Capitulation in Crypto Trading?
Typically, capitulation occurs after panic selling in a market cycle. It’s the stage when investors who were holding onto hope finally give up and sell their positions at a loss before the final downturn and potential bottom. See the illustrations in the chart below.

Traditionally, capitulation marks the point of maximum financial pain but also the greatest opportunity. It removes the "weak hands"—short-term speculators. And when most investors sell in a panic and only a few remain to push the price lower, the market usually hits a bottom.
This pattern happens across stocks, cryptocurrencies, and metals; it's how market bottoms form. However, our data shows that we haven't reached that point yet. Here's what I mean...
The “Oversold” Cheat Code
I often receive numerous questions from my subscribers asking, “Jonas, when is the right time to buy since we are officially in a bear market?” Well, here’s how you can safely invest during this downturn, without burning your fingers. To determine if we are at the true bottom of the market, we can use a specific variation of the Weekly RSI oversold strategy. Please see the chart below for more details.
Here’s the Setup to Watch:
Most traders look for an RSI below 30 to indicate oversold conditions. In a real capitulation event (like the one we're witnessing in 2026), we seek out extremes. Let me explain further…
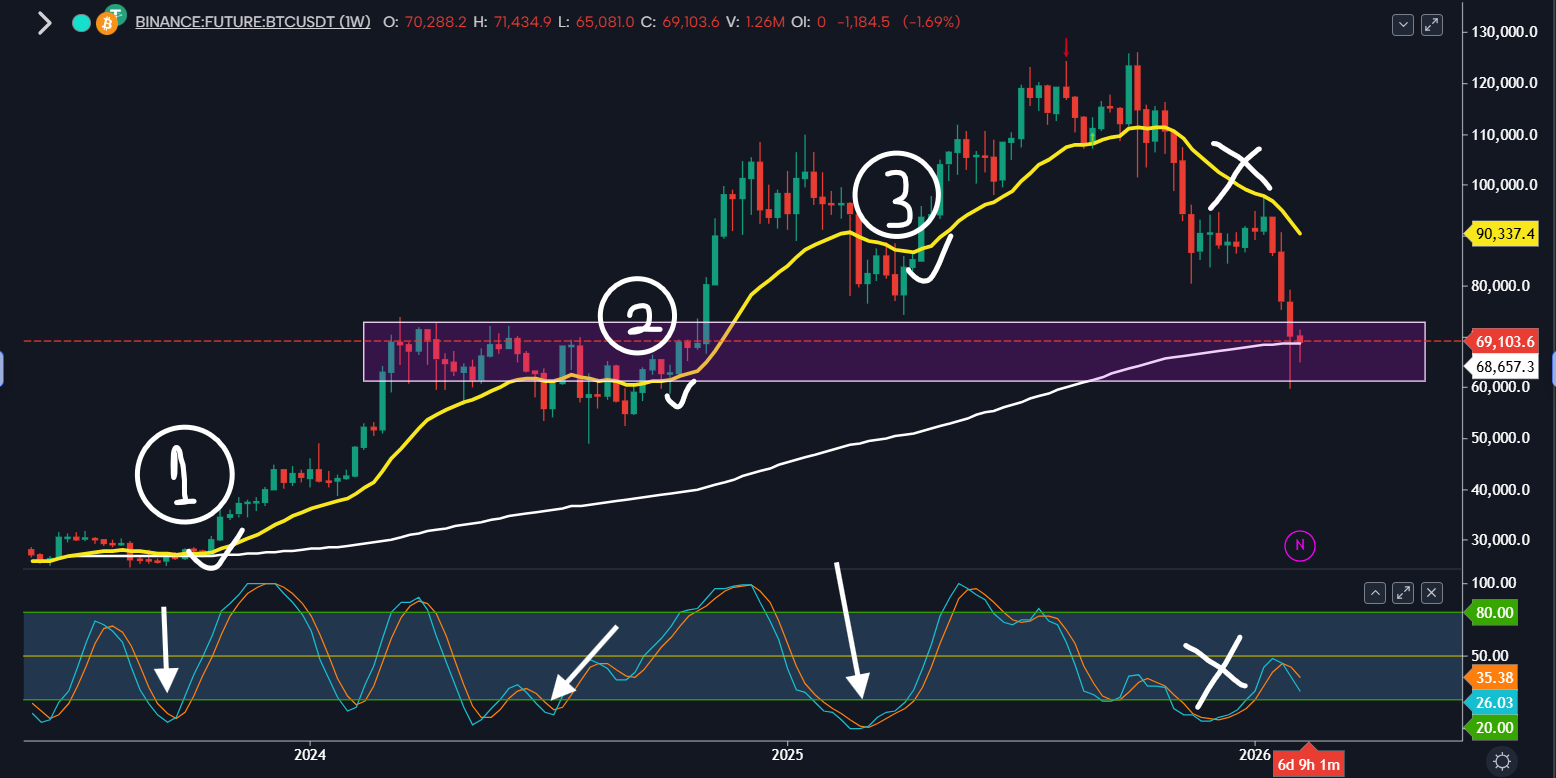
Weekly RSI must remain below 8%: This indicates an extremely oversold condition. While rare, it suggests that selling pressure has been mathematically exhausted. That’s not all…
Price versus 20-Week EMA: Ideally, during a “dip within a bull market,” you want the price to stay above the 20-week EMA while the RSI resets. See points 1, 1,2, & 3 in the chart above.
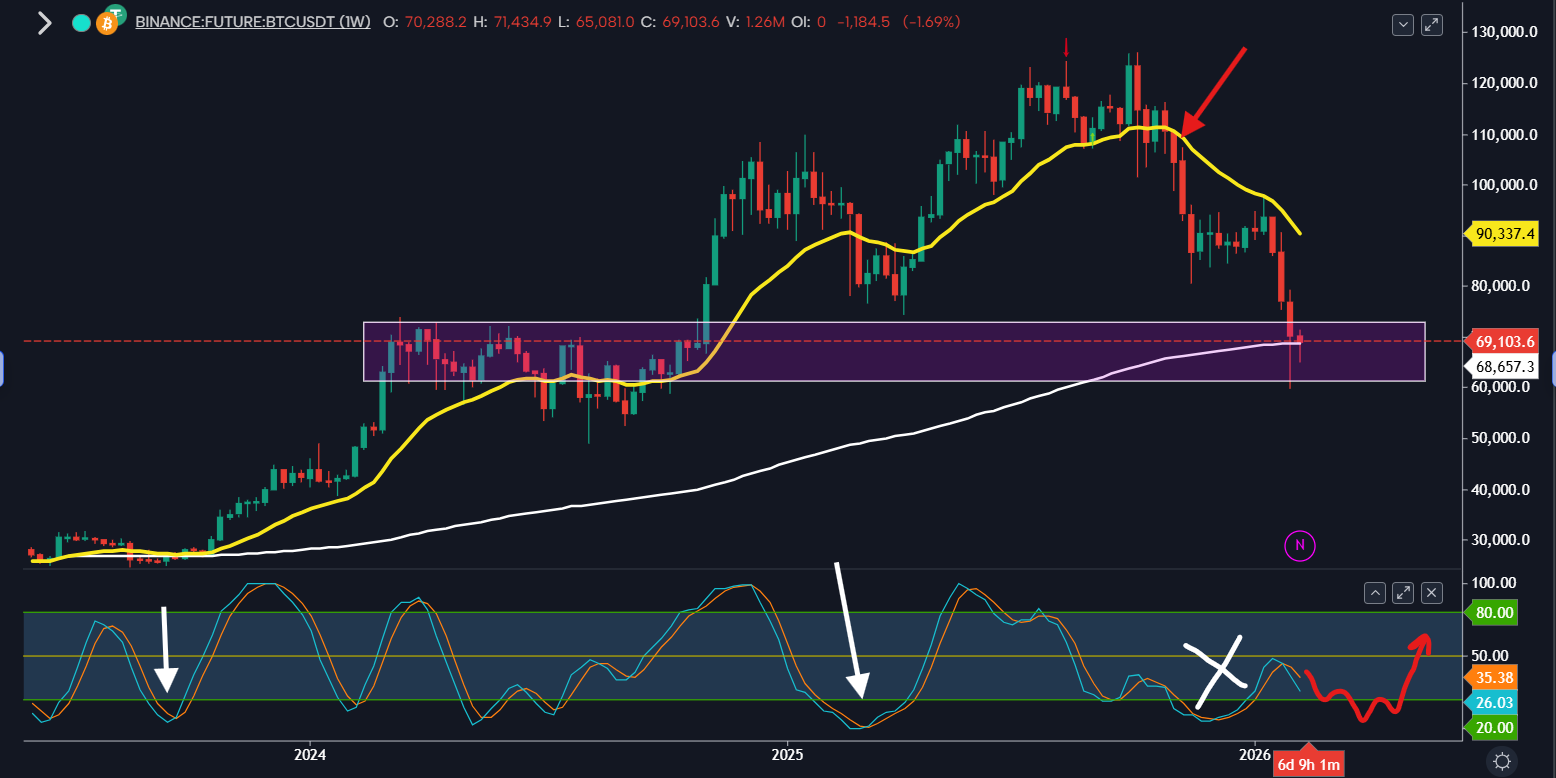
Note: Currently, due to the sharp decline from $110k in November 2025, we have lost both the 20-week and 200-week EMAs. This confirms we are in a bearish phase, not just a dip. Therefore, we now need to wait for the RSI to drop below that sub-8% level to signal a reversal before expecting a potential bottom. See the chart below.
The point is, we don’t need to panic or rush to buy the dip.
We might spend the next few months trading between $84,000 and $58,000 before the next phase, which could cause significant pain because everyone who thought they bought the bottom in this zone might be forced to give up and walk away with losses. That could be the reality that unfolds next…
Market Reality: The $79k Breakdown & $45k Target
Let’s review the BTC-USD weekly chart again. The Bitcoin head-and-shoulders pattern was clear a few weeks ago, and I wrote a detailed report about it. Now, I am more concerned because we're on the verge of losing the final support line, which is the 200-week EMA. See the blue band in the chart below.
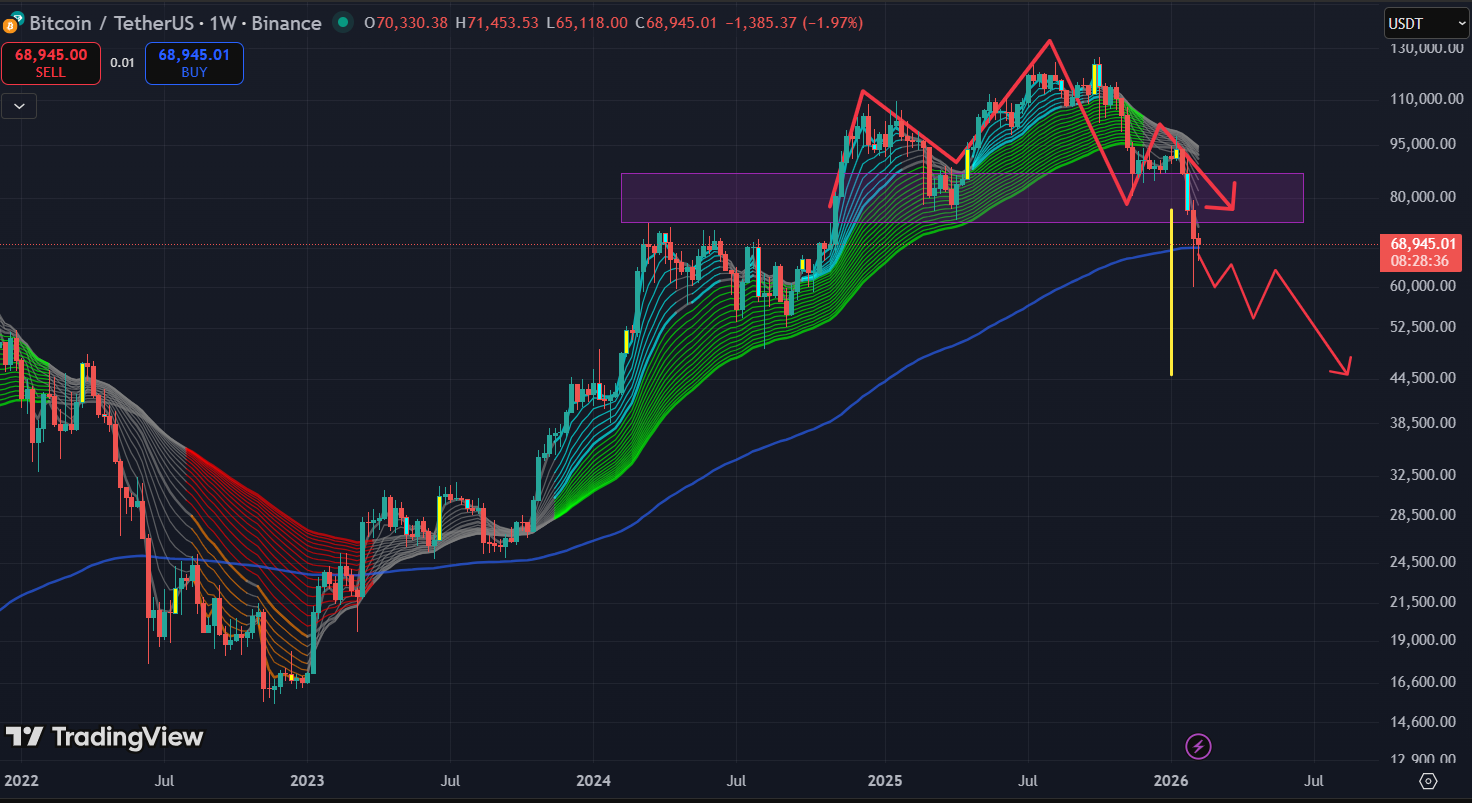
Look, when we broke below the $79k-$77k support zone, that level effectively failed. And based on the head-and-shoulders pattern, this suggests a price target of $45k for Bitcoin. Once again, this matches our prediction that Bitcoin could fall another 30-35% before hitting a long-term bottom. This brings us to the question…
Is Bitcoin Currently Overvalued or Undervalued?
Well, with the price currently dropping quickly, many investors are asking the same question. Bitcoin isn’t overvalued in my opinion, considering that the price recently fell from above $126,200 to below $60,000 in just a few weeks. However, on-chain metrics like MVRV (Market Value to Realized Value) are cooling off quickly, despite fear and uncertainty in the market.
So, if we hit the $45k-$50k range, Bitcoin will be trading below its “fair value” energy cost of production for many miners. This is historically the “Buy Zone” where smart money starts accumulating.
Again, remember that nothing is guaranteed. Market conditions can change suddenly, and the price might never reach that zone or even break below it. So, prepare for both scenarios and strategically DCA into Bitcoin and Ethereum.
How to Thrive When Others Give Up
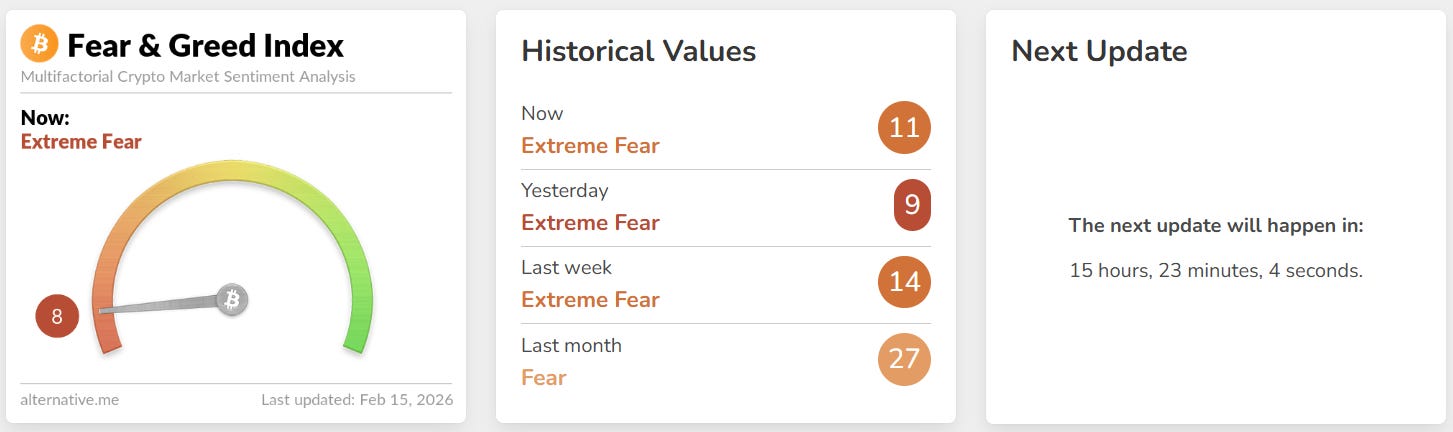
Capitulation can be frightening, but it is necessary. Right now, the Bitcoin Fear and Greed Index is showing “Extreme Fear (8%).” This is your signal. However, we might see another drop. So…
Don’t Panic Sell: If you haven’t sold yet, selling at the bottom is the worst move you’ll live to regret.
Watch the Indicators: Wait for the Weekly RSI to hit our extreme targets (below 8%).
Prepare Cash: The wealth in crypto isn’t made by buying the top; it’s made by buying the capitulation.
Now, the question is, where could Bitcoin be headed in the coming days?
Well, we should expect significant volatility as we test the 200-week EMA. And if it holds, we could see a recovery that bounces Bitcoin toward the $74,000 to $84,000 range. However, if it breaks below this level, we might find ourselves at around $45,000.
Remember, these projected targets won’t happen overnight; they might show up as a gradual decline or a quick crash.
No matter the result, make sure you’re strategically positioned by investing during times of maximum opportunity. This will help you rebuild your portfolio before the expected 2028-2029 bull market. That’s all I have for you.
Thanks for reading. Before you go, click below to explore more strategies for building long-term alternative income streams.
See you soon!
P.S. Need More Help and Resources?
Buy and sell crypto on Bybit, my preferred crypto exchange.
Download the Crypto Traders’ Handbook
Download Your Bear Market Optimizer Toolkit