
Mastering Support and Resistance Like a Pro Trader (Technical Analysis Pt 1)
Your practical guide to spotting order blocks and making smarter entries

Hello everyone,
You’re about to learn one technical analysis skill that can change how you approach the market. Yes, this skill isn’t just another trading concept—it’s the foundation for building consistent swing and day trading strategies.
I’m talking about support and resistance.
I know you’re familiar with the concept. But here’s the real question: how do you identify and draw them correctly? Do you focus on a single line or an entire trading zone?
Before this conversation goes technical, take a moment, adjust your seat, and let’s break it down.
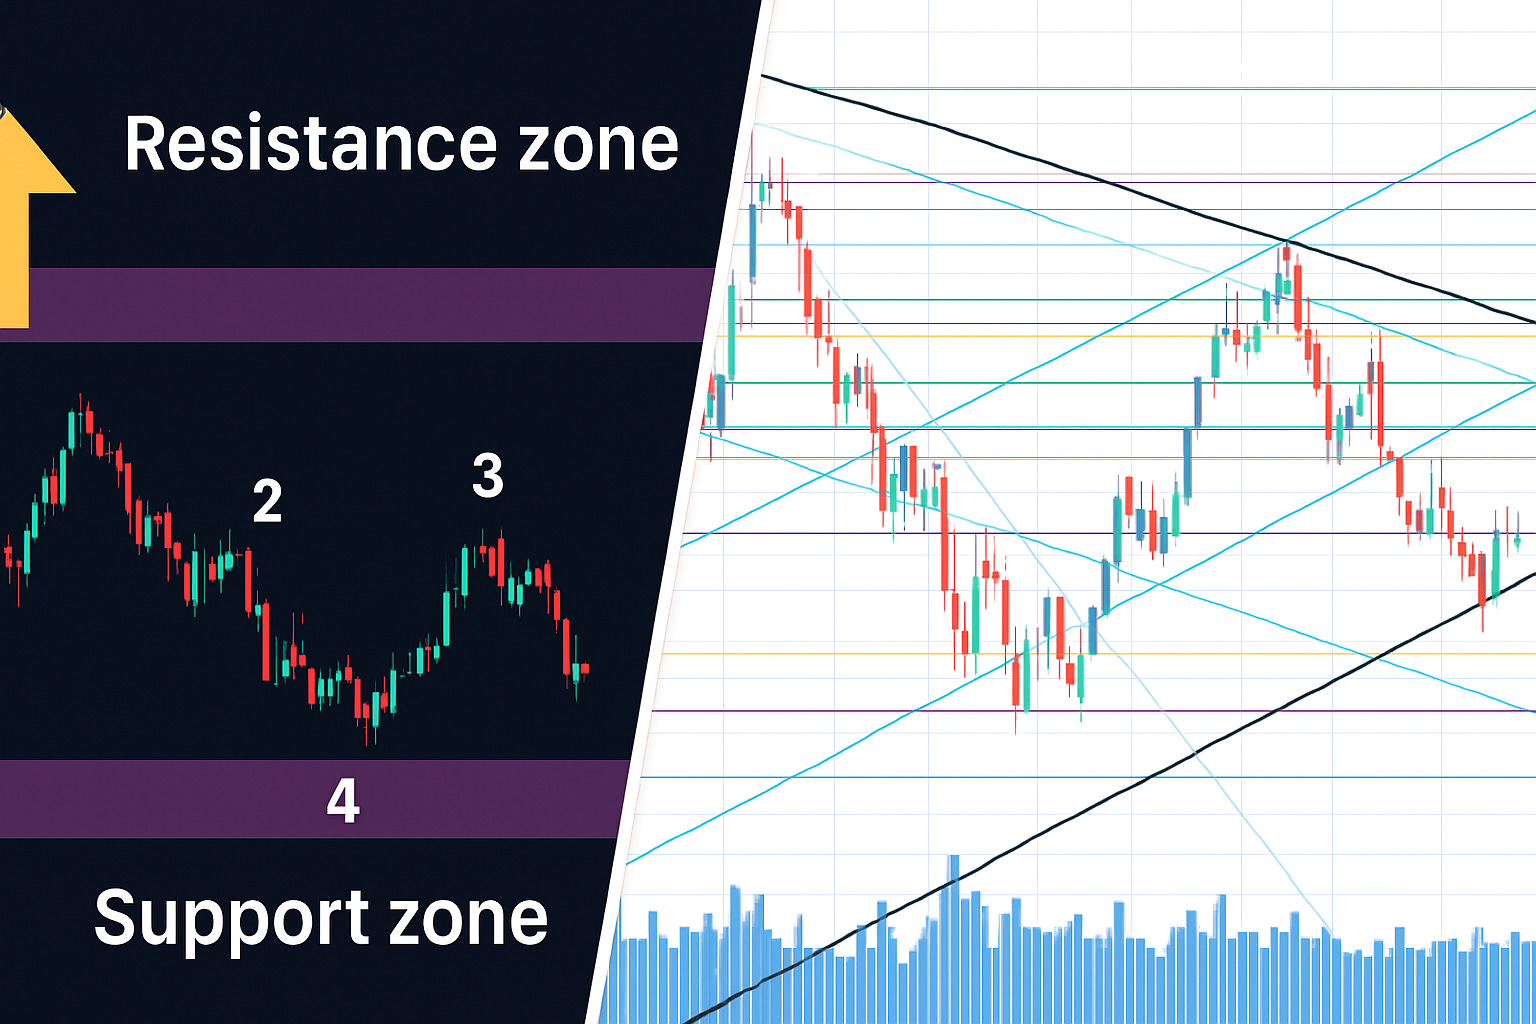
You see, when it comes to support and resistance trading strategies, most traders stop at drawing lines on a chart, leaving money on the table. In real trading, price rarely respects a single line. Instead, it reacts within a zone. And that’s what we are here to unpack.
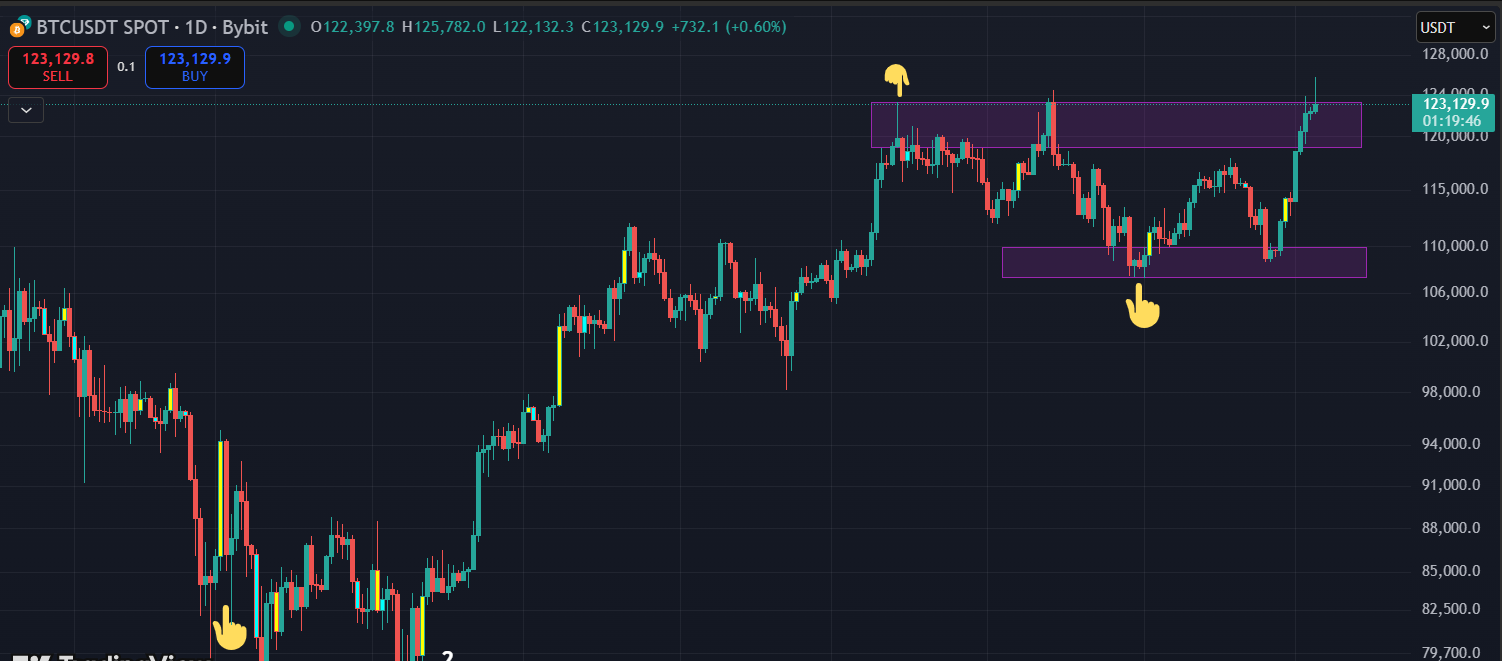
First, look at the chart below and focus on the two rectangular purple boxes. They represent support and resistance zones on the BTC-USD daily chart.
Now you may be wondering…
What Is the Support and Resistance Strategy All About?
In simple terms, support refers to a price level where buyers come in to prevent a price drop. You can think of it as a floor that stops the price from falling further, or like a trampoline that pushes you higher whenever you step on it.
Note: When the price breaks below a support zone, that very area becomes resistance.
Now, let’s discuss resistance.
Resistance, in contrast to support, is where sellers come in and push the price back down. You might envision it as a ceiling that prevents prices from rising. And when the price eventually breaks above resistance, that level often turns into new support. (You can find more details inside the Crypto Traders’ Handbook.)
Now, see the classical example of these levels in the SOL-USD daily chart below.
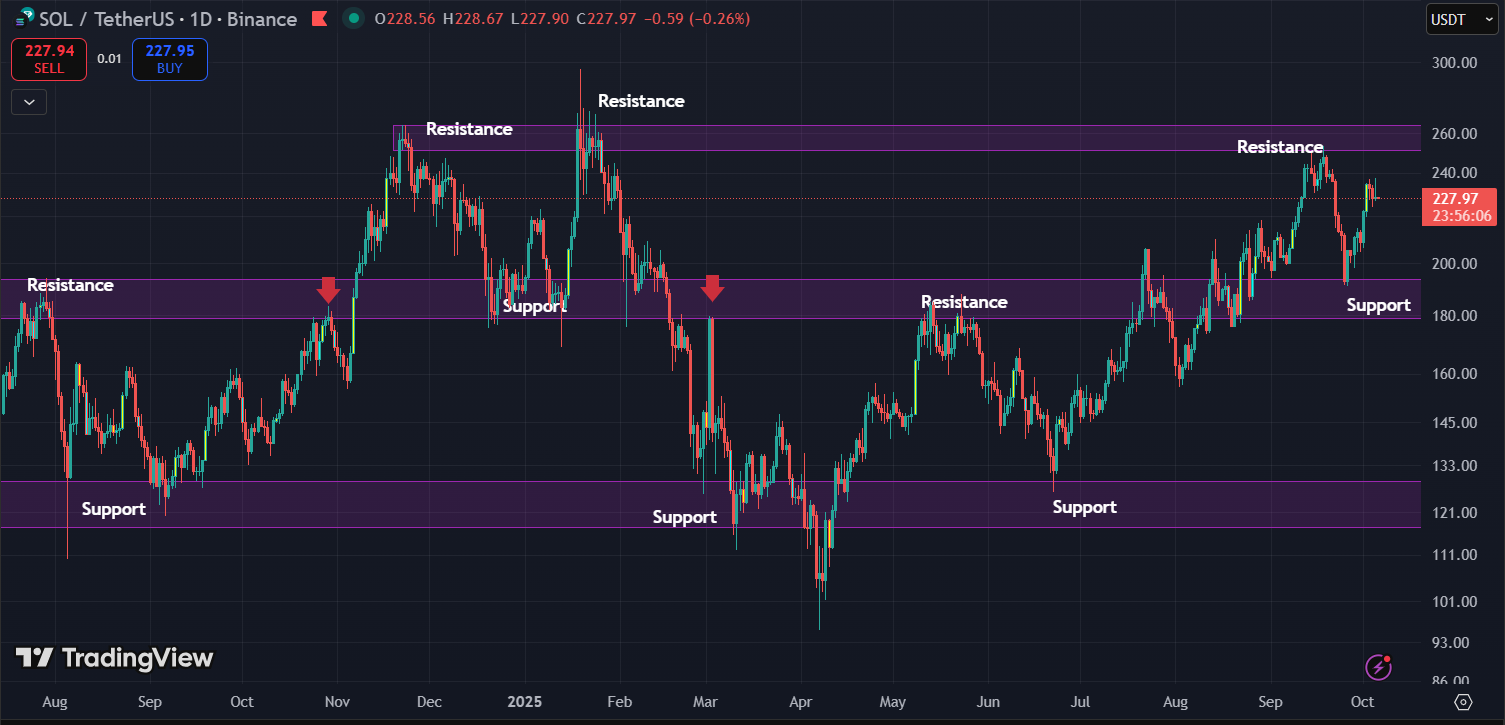
From the chart above, each rectangular box represents a zone, not a line. And there’s a reason for that. You see, a zone can absorb price wicks and noise, while a single line often triggers false signals. Sadly, many analysts don’t pay attention to such scenarios. Now, let’s take it further…
Zones vs Lines

Does your chart resemble the one above, or is it simple and clean?
I often see beginners draw multiple lines across their charts and keep adding more as market conditions change. Ultimately, this can lead to confusion and conflicting signals, which I refer to as information paralysis.
The reality is that a level drawn without proper context can be misleading. This is why we focus on trading zones instead of relying solely on lines.
For context, a tradeable zone usually:
Shows repeated tests or rejections
Matches areas where price paused or reversed
Aligns with higher timeframe structure
Sadly, many traders overcomplicate this part. You’ve probably seen charts full of random lines and no clear direction. When that happens, identifying the true support or resistance becomes guesswork. For example, what are the key support and resistance areas on the chart below? This isn’t technical analysis, it’s complete chaos.
Now, let’s make it practical.
Currently, Bitcoin trades around $123,500 after consolidating for days. But by carefully looking left on the chart, you’d notice that BTC faced rejection in that zone (near $124,500) in August before dropping to $108,000. See the yellow arrow in the chart below.
Interestingly, when price revisited the $108,000 region, it found strong support. Hence, smart investors recognized that zone as a demand area. From there, BTC rallied from $107,500 to the current $122k–$125k range. See the chart below.
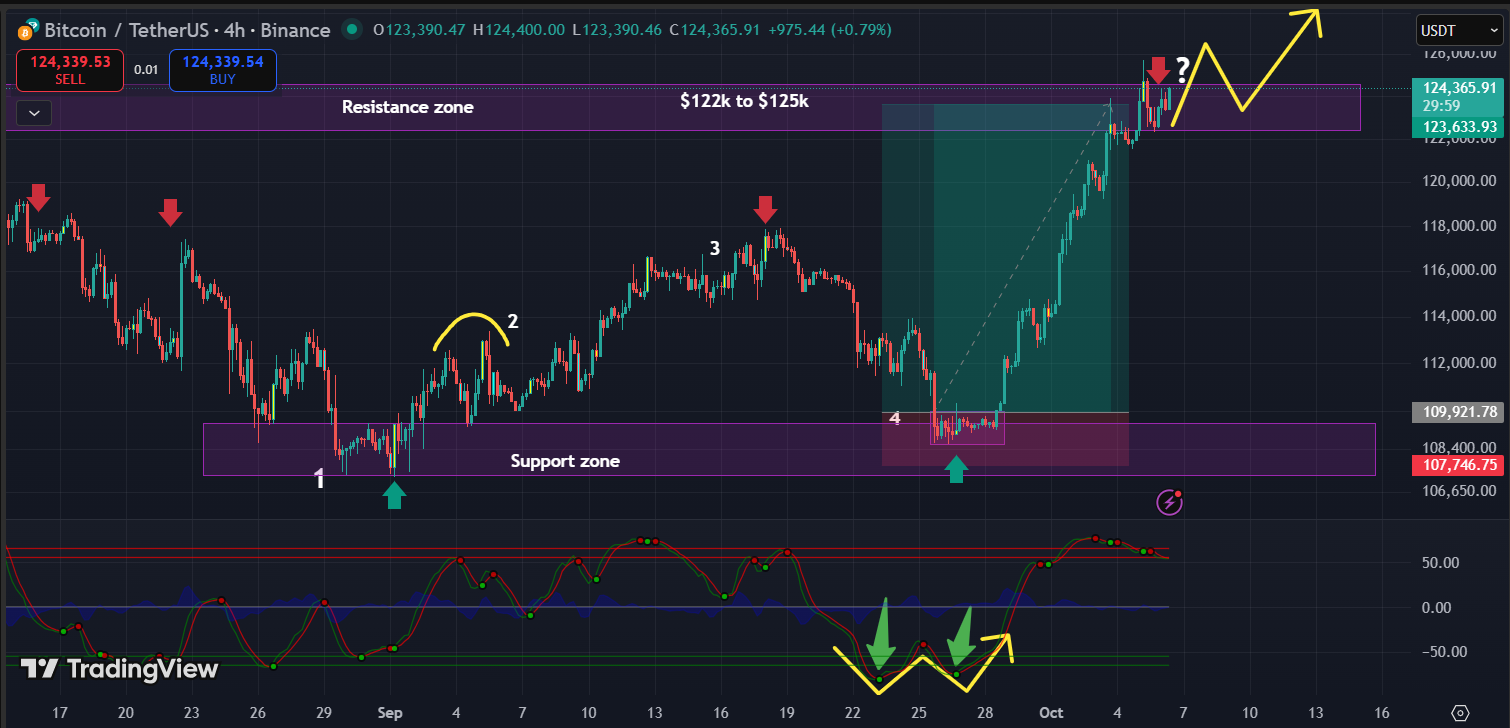
Now, if Bitcoin closes two consecutive bullish candles on the 4H above $125,800 and retests the area without breaking below the upper purple box, that level automatically flips into strong support. See the chart above.
This is how you master support and resistance—it’s not theory, it’s practice.
Next, let’s see…
How to Draw Support and Resistance Zones
Forget drawing single lines. Think in zones instead.
First, head over to TradingView and open the BTC-USD pair.
Start by looking left on your chart. And select the 4H or 1D timeframe.
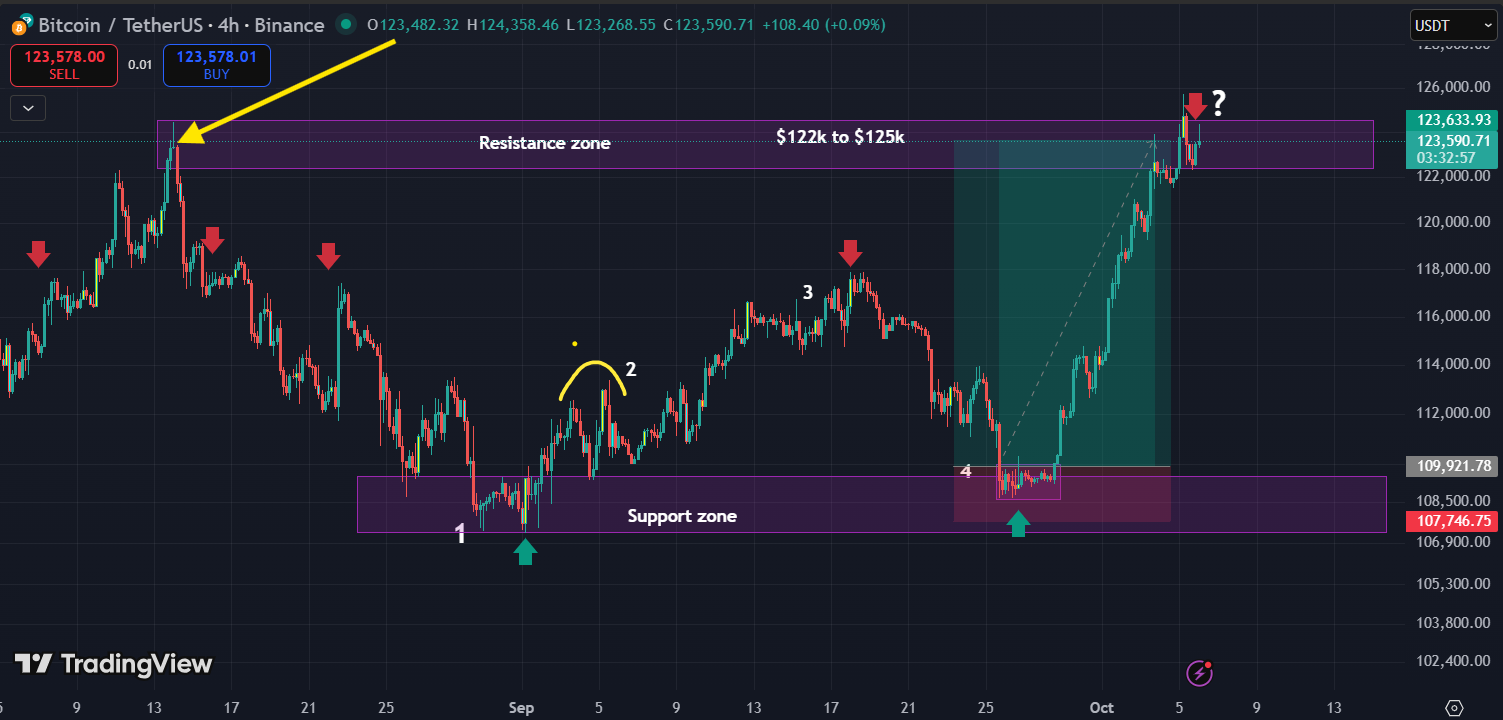
Then, identify the last bullish candle in an uptrend before the price reversed. That’s a key zone. See the example below.
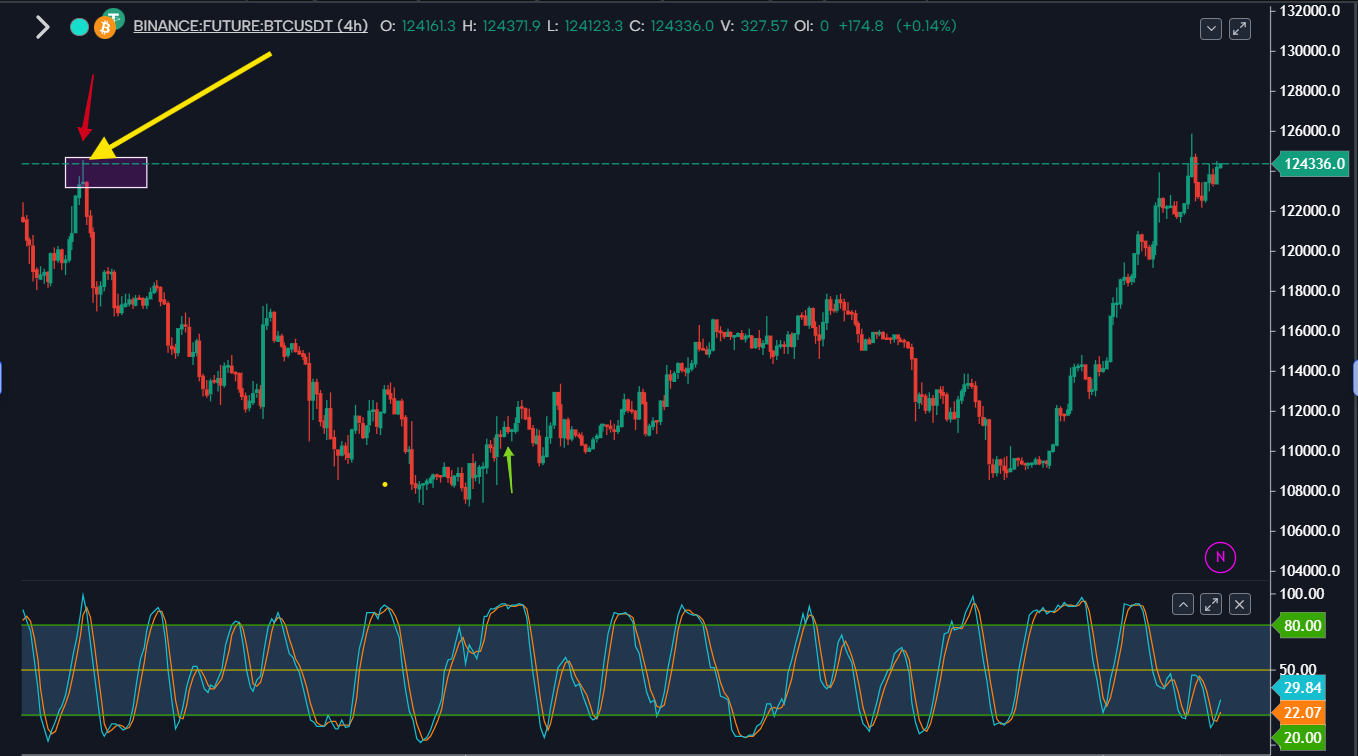
Next, mark that candle with a rectangle, not a line, and drag it right. When price revisits those areas, it often reacts again because traders remember those levels.
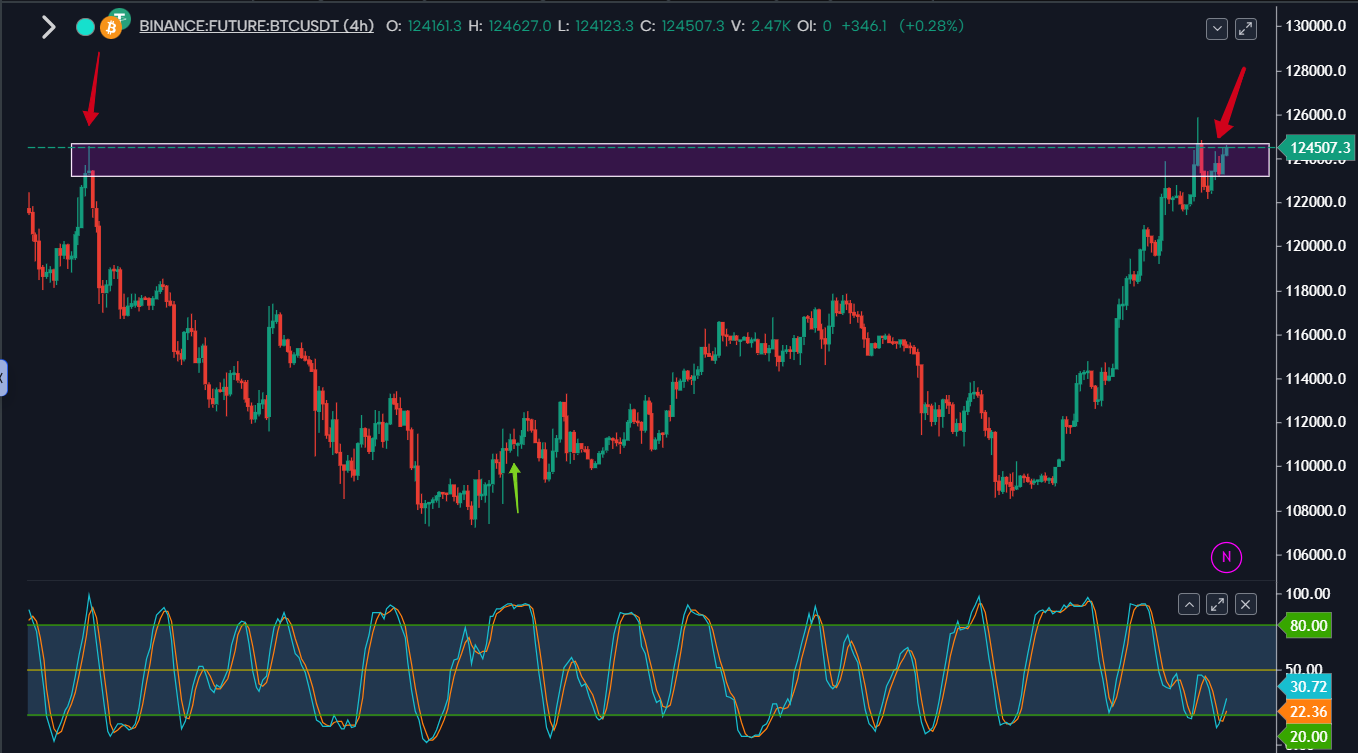
Now, see the chart below to observe how BTC behaves inside that zone over the past few days. This zone acts as resistance, and Bitcoin needs to break above to flip it into support. The reaction confirms that zones work better than arbitrary lines. See the red arrows in the chart.
What you’ve learned so far is just the tip of the iceberg. There is a more effective way to refine these zones—by understanding order blocks.
Introducing Order Blocks
Order blocks are areas where institutional traders placed massive buy or sell orders before a major price move. Think of them as footprints left by smart money.
Amazingly, when price returns to these zones, it often reacts sharply because those institutional traders either defend or unwind their positions. That’s exactly what we are experiencing at the $125,000 psychological resistance zone on the BTC-USD pair.
In subsequent parts, we shall discuss order block trading strategies in detail. But remember, there are two types of order blocks: bullish and bearish. Both are covered in detail inside the Crypto Traders’ Handbook.
So, if you want to learn how to identify key supply and demand zones, set precise profit targets, and enter trades with confidence, grab your copy.
You see, support and resistance aren’t just patterns—they’re where money changes hands. The more you study them, the clearer the market becomes.
The truth is, every profitable trader masters this skill. To become one, learn to mark your zones, stay patient, and keep refining your craft.
For the full breakdown of this topic—including detailed chart examples, trade setups, and real-life case studies—
Download your Crypto Traders’ Handbook (PDF) today for just $29.99 before the price jumps to $97.
Don’t wait any longer. Learn the structure now. The profits come later. I will see you soon.
Btc holding strong after new ath 🤩👍